Overview
RAMP's Advanced Yield Analytics provides detailed ad revenue analytics and insights into your website's yield ad traffic acquisition performance.
They feature multiple reports focusing on an essential aspect of your ad revenue, including demand source, publisher, website, browser, etc.
With our Advanced Yield Analytics, you can:
- Get analytics and insights from simple and intuitive pre-built reports
- Leverage Playwire's First-Party data
- View reports focusing on specific yield ad traffic acquisition performance, such as demand source, browser, ad source, ad format, etc.
- View a chart section to help you visualize data over time
- Add dimensions to the report so you can get better insights
- Apply more filters so you can focus on metrics that answer your specific business needs
The reports are available at the publisher (or account) and website levels. The main difference between these is that the account metrics are calculated on a per-account level. At the website level, you can see the metrics specific to each website.
You can access them in RAMP by doing the following:
-
For account-level analytics, click the Analytics option in the top navigation bar.
-
For website-level analytics, click the Supply option in the top navigation bar. From there, click the Websites tab and the name of the specific website you want. You should see the reports under Analytics.
Available reports
Account-level reports
Account-Based
-
Subaccount
Web
-
Time-Based
-
By Day
-
By Hour
-
-
Content
-
Website
-
-
User/Environment
-
Browser
-
Country
-
Device
-
-
Ad Type
-
Ad Source
-
Ad Format
-
Ad Unit
-
Ad Size
-
-
Demand
-
Demand Source
-
Website-level reports
Demand
-
Demand Source
Acquisition
-
UTM Source
-
UTM Medium
-
UTM Campaign
-
Referrer
Content
-
Page
User/Environment
-
Browser
-
Country
-
Device
Ad Type
-
Ad Source
-
Ad Format
-
Ad Unit
-
Ad Size
Time-Based
-
By Day
-
By Hour
What is UTM?
The Urchin Tracking Module (UTM) is a code added at the end of your page's URL that helps you track where your web traffic is coming from.
Dimensions and Metrics
Dimensions
A dimension is an attribute of the data and is usually a text, as opposed to a metric, which is a number. Adding another dimension is beneficial in two ways: (1) it gives you additional information about the metrics (2) you can make correlations that can drive your performance.
Sample use cases:
-
You added the Browser dimension in the Website (account-level) report. In doing so, you noticed that Website A's highest revenue came from visitors who used Chrome.
-
In the Device report (website-level) for Website A, you added Country as another dimension. In doing so, you noticed that for Website A, the highest revenue came from visitors from the United States who used their desktops to view the site.
Available dimensions for account-level pages
- Data range, compare to (default)
- Subaccount
- Website
- Country
- Device
- Ad Format
- Ad Size
- Ad Unit
- Ad Source (such as Display, Video, App)
- Browser
- By Day
- By Hour
Available dimensions for website-level pages
- Data Range with Compare to (default)
- Page
- Country
- Device
- Ad Format
- Ad Unit
- Ad Size
- Ad Source (such as Display, Video)
- Demand Source (such as Playwire, SSP, AdX, etc.)
- Browser
- UTM Source
- UTM Medium
- UTM Campaign
- Referrer
- By Hour
Metrics
In RAMP's analytics, a metric is a measured quantity. For example, Revenue is the total number you earned for the date range specified in the report.
Available Metrics for publishers/customers
- Est. Revenue - The total revenue earned
- RPS - The revenue earned per session
- PV RPM - The revenue generated per thousand pageviews
- CPM - The revenue earned per thousand impressions
- Fill % - The rate at which an ad was successfully able to serve
- Sessions -The number of sessions that began on the website or app
- Pageviews - The total number of pages viewed, as reported by Google Analytics
- Requests - The number of ad requests made to the ad server
- Impressions -The number of times an ad loaded
- CTR - The Clickthrough rate (CTR) is the number of clicks your ad receives divided by the number of times your ad is shown, as reported by GAM.
- Viewability -The percentage of viewable ad impressions, as reported by GAM
- Reqs/ Sess - The number of ad requests per session
- Imps / Sess - The number of impressions per session
- Reqs / PV -The number of ad requests per thousand pageviews
- Imps / PV - The number of ad impressions per thousand pageviews
- Ad Request CPM -The revenue earned per thousand ad requests
- Avg Sess Duration -The time frame during which there are regular active interactions occurring from a user on a website. It only includes sessions that have multiple interactions with the site.
Note
CTR and Viewability are available in the following reports:
Website-level Analytics
- Time Based by Day
- User Environment > Device
- Ad Type > Ad Format
- Ad Type > Ad Unit
Account-level Analytics
- Content > Website
How to review the Advanced Yield Analytics pages
Each of RAMP's Advanced Yield Analytics follows the same workflow for an easier and better user experience. In the steps below, we'll examine the Browser analytics page.
-
Do one of the following:
-
(For account/publisher level) On the top navigation bar, click Analytics to open the Analytics page. Go to the page you want. For this example, go to User/Environment > Browser.
-
(For website level) On the top navigation bar, click Analytics. Use the dropdown to select Website, enter the name of the website in the search field, and go to Analytics > User/Environment > Browser.
-
-
Click Dimension toopen the dropdown where you can select the available dimensions for the report. You can add up to 1 dimension.
When you select a dimension, the table below adds that dimension as a column that gives you additional information about the data. For example, when you add Country, you can see what browser is primarily used in certain countries.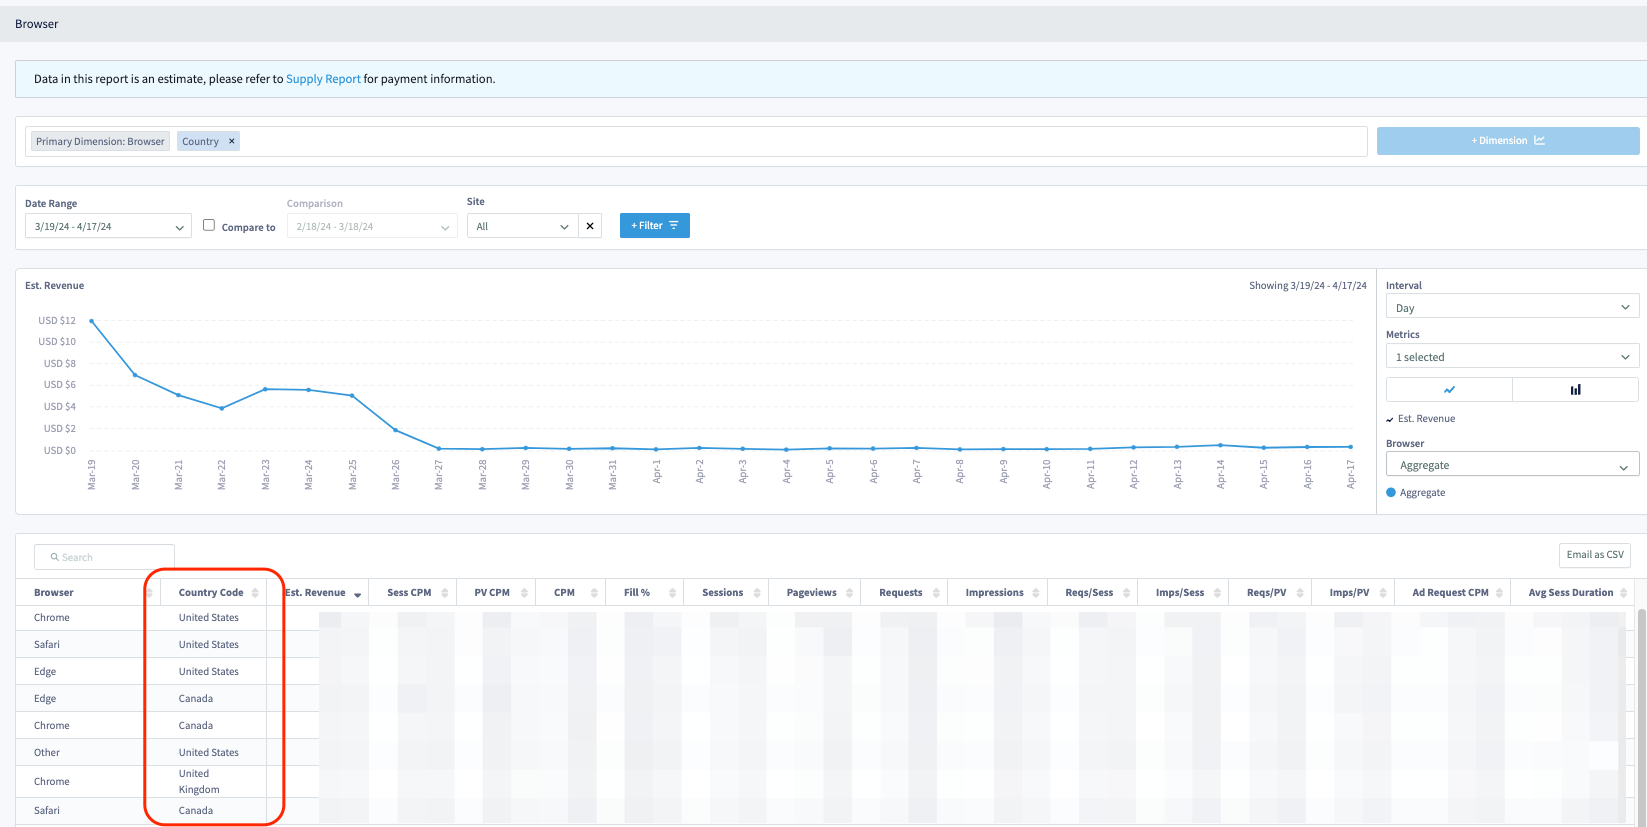
-
Click Filter to open the dropdown where you can select and add the available filters for the report. You can add all the available filters.
When you add a filter, it opens a secondary dropdown option that lets you filter the report further.
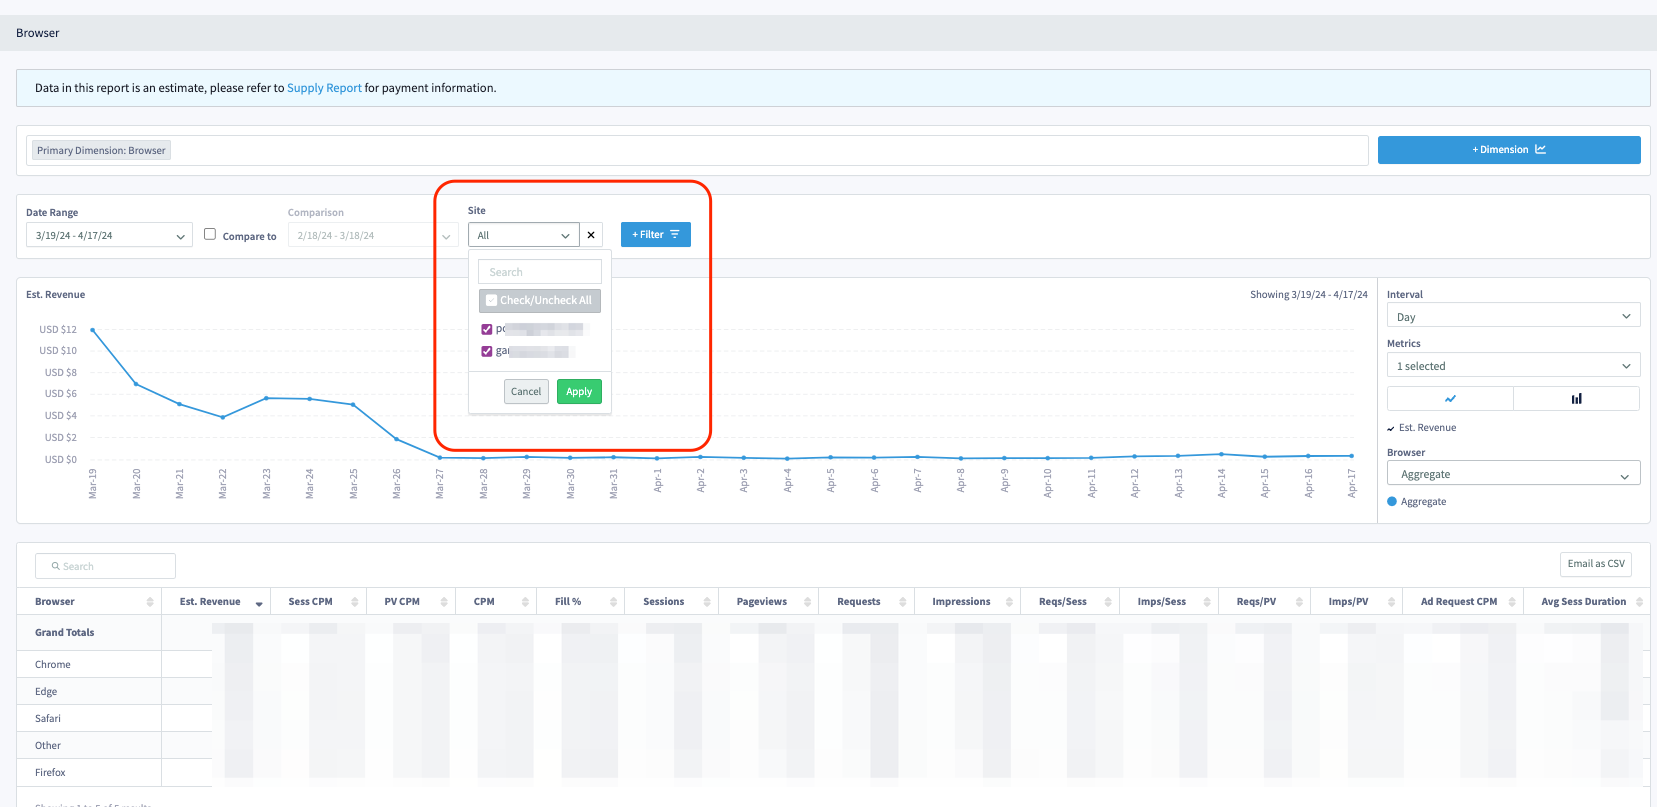
Note
When you select a filter from the secondary dropdown, you must click Apply so RAMP can apply that filter and recalculate the metrics.
Adding filters helps answer specific questions you may have about your performance. For this example, by adding a Site filter to the Browser report, you can dive deeply into how your sites perform on specific browsers.
-
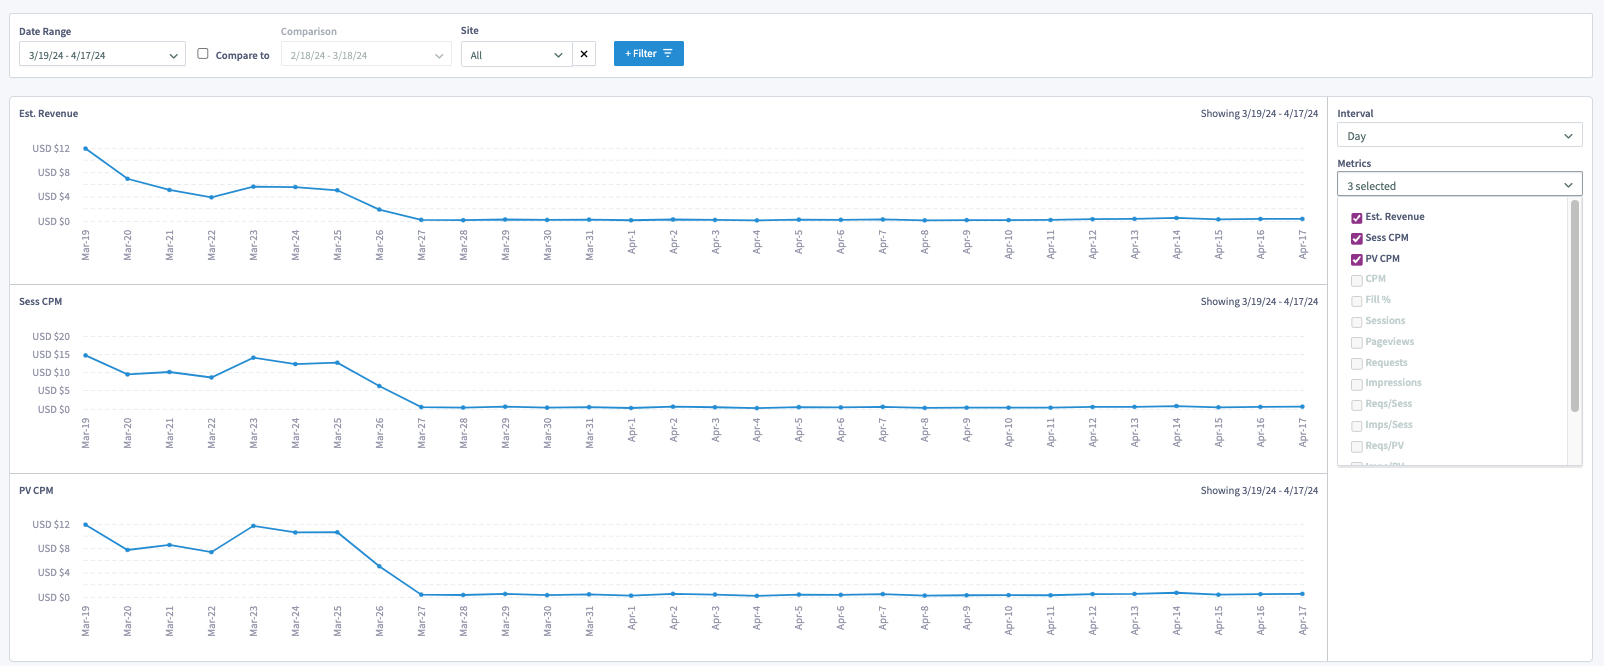
In the chart section, do any of the following:
-
Use the Interval dropdown to select the date range interval, which can be by Day, Week, or Month.
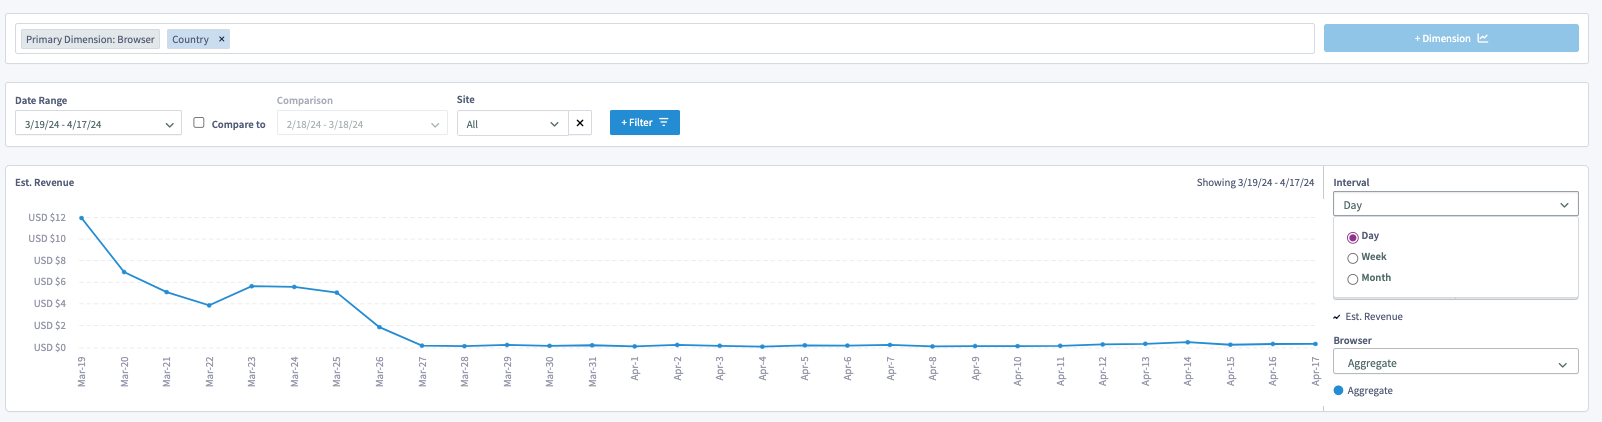
-
Use the Metrics dropdown to select the metric(s) you want. Each metric creates a graph. You can only select 3 metrics at once.
-
Click the line or bar graph icon to select your preferred data visualization.
-
Use the Browser dropdown to select the browser-specific data you want or to see the aggregate values for all browsers. You can select up to 5 options.
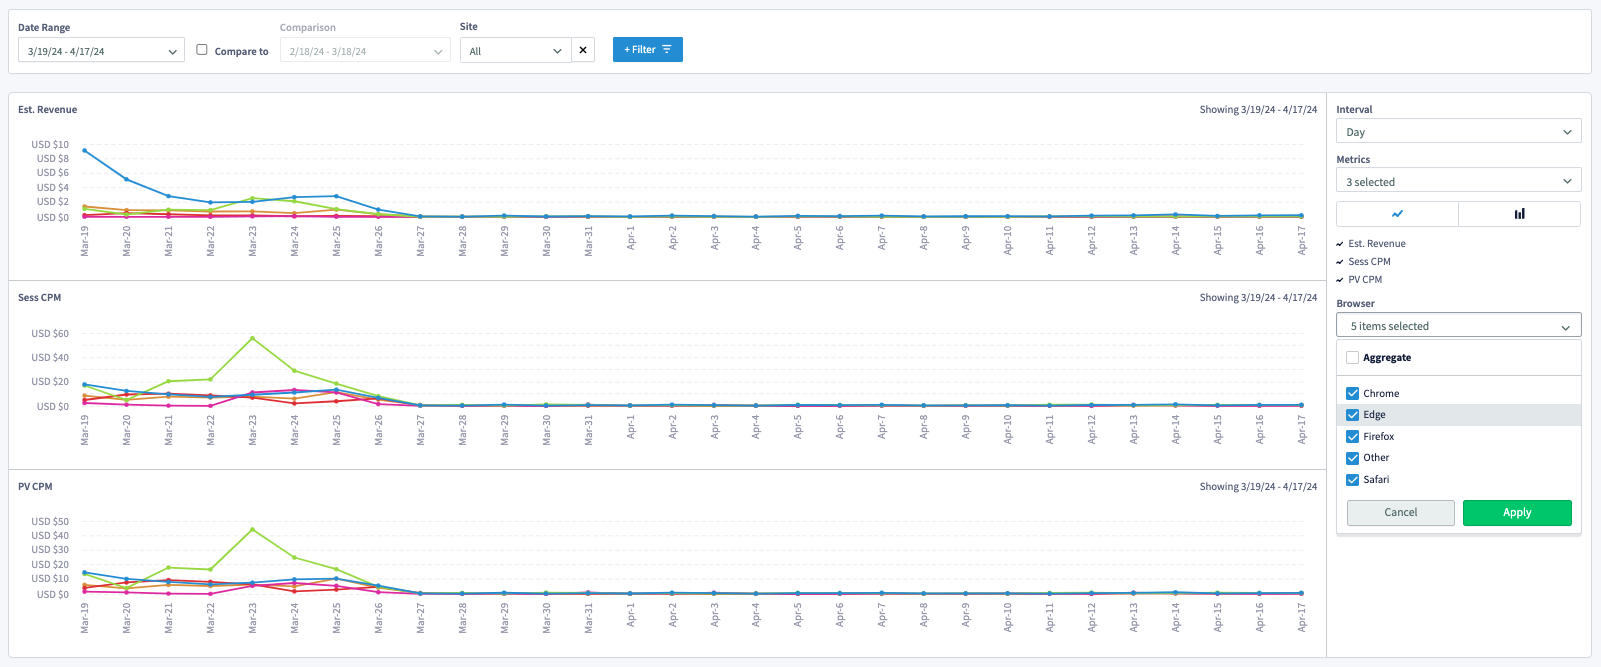
Note that this dropdown changes based on the report that you're in. For example, if you're in Ad Type > Ad Source report, the dropdown should be Ad Source.
-
-
Click the Compare to checkbox to compare date ranges. Previous Period is selected by default. However, you can choose any pre-defined date ranges or set your own (Custom Range).
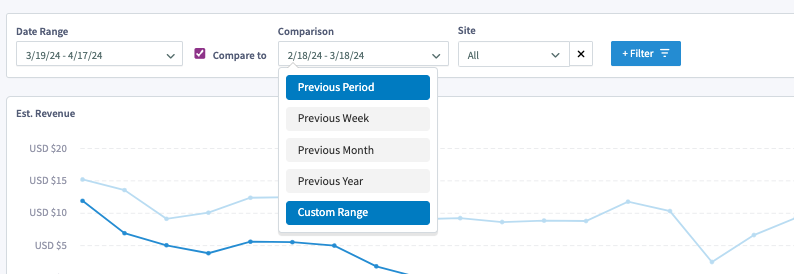
After setting the second date range, the page calculates and shows the % Change for the date ranges and Grand Totals.
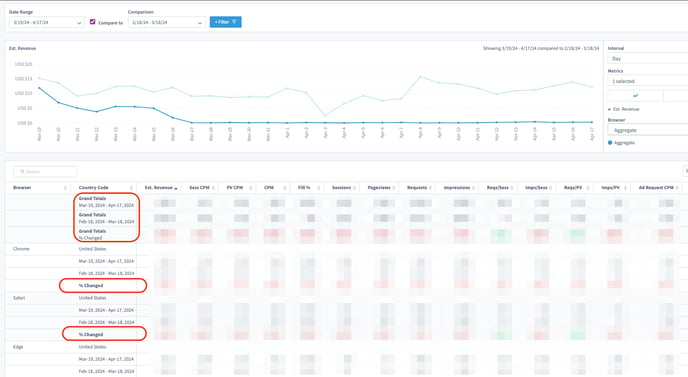
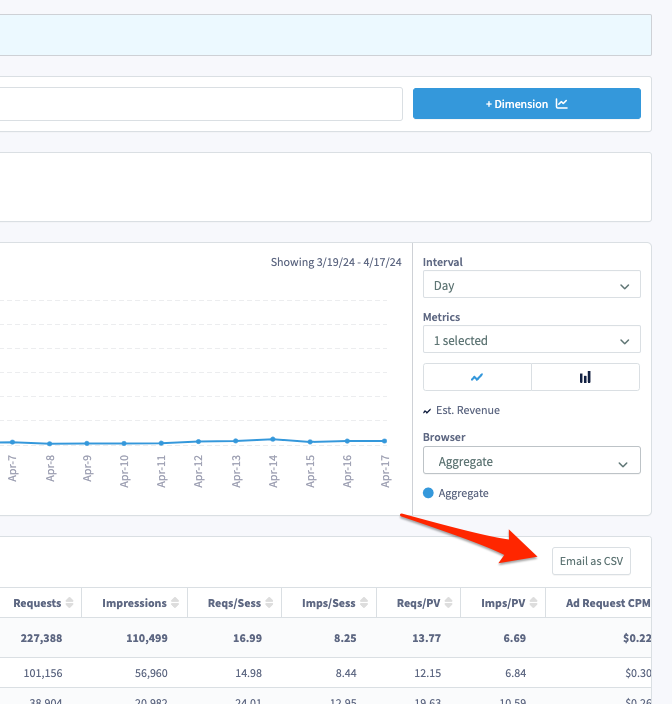
-
Click Email as CSV to get a CSV copy of the report by email. If you selected Compared to, the Change % for each date range and Grand Totals will also be included in the CSV file.